


What Financial Markets Are Telling Us About the Iranian Military Conflict
Former JPMorgan Chase Global Chief Economist (Ph.D. in Economics) & Global Keynote Speaker


Getty Image (Angel Di Billio) of the B-2 Stealth Bomber
Following the U.S. bombing of three Iranian nuclear sites, financial markets are trying to assess the likelihood of military escalation, potential disruptions in the supply of oil, or the possibility of a broader geopolitical conflict.
Right after the bombing on Saturday night, the sentiment was that this was a one-and-done operation after the U.S. warned Iran not to retaliate and just focus on attaining a diplomatic agreement with all parties. But on Sunday night, the conversation took an ominous turn when President Trump hinted that a regime change might be possible.
To interpret the market's expectations, we track the following variables: the betting odds for the possibility of regime change, the odds of a potential closure of the Strait of Hormuz, the DXY U.S. Dollar Index, the 10-year Treasury yield, and Bitcoin prices. Each metric reflects a different aspect of the situation. When considered together, they may offer the best perspective on whether financial markets are preparing for conflict, hoping for a breakthrough, or fearing the worst.
Polymarket.com, a highly respected international wagering site for non-U.S. bettors, currently places the odds of regime change in Iran by July 31, 2025, at 38%, down slightly from 41% on June 22, 2025. While prediction markets are not infallible, they reflect the aggregated judgment of people willing to put money on geopolitical outcomes.

Source: Polymarket.com
However, if the Polymarket.com odds of a “regime change” rise above 50% within the next week, it could suggest markets are pricing in not just escalation, but transformation in Iran’s political order.
Another closely monitored risk is the potential for Iran to plant explosives in the Strait of Hormuz or obstruct these shipping lanes, which could disrupt 20% of the global oil supply and elevate oil prices. Polymarket.com places the odds of such a disruption at 48% for this year, down from 60% on June 22, 2025. If this downward trend persists, it would be reassuring for anyone concerned about escalating war tensions.

Source: Polymarket.com
The DXY Dollar Index: Is the Greenback Entering Safety-Haven Mode?
The DXY Index, which measures the U.S. dollar against a basket of major currencies, serves as a key proxy for global risk sentiment. A sharp upward move in the dollar often reflects an international flight to safety, particularly during crises that threaten emerging markets or global oil supplies.
Following the bombing, the DXY rose modestly to 99.03, up 0.32, but not dramatically, signaling that markets remain in “watch and wait” mode. However, if Iran retaliates in a way that threatens oil shipping routes (such as the Strait of Hormuz) or if the U.S. responds with additional military escalation, expect a more aggressive rally in the DXY.

Source: Yahoo Finance
If the DXY index pushes above 101.0, it would mark a risk-off shift, implying markets see this conflict potentially spiraling beyond a limited exchange of hostilities.
The 10-Year U.S. Treasury Yield
For decades, the 10-year U.S. Treasury has been regarded as a global safety-haven benchmark. However, in recent months, its capacity to function as a traditional haven has been called into question. During periods of domestic fiscal stress—particularly the debt ceiling impasse and rising U.S. deficits—investors have been reluctant to view Treasuries as a reliable refuge in times of turmoil.
Still, a military crisis is a distinct phenomenon. Unlike fiscal concerns, which are domestic, a global conflict is likely to restore Treasuries’ appeal as a security of last resort. If the yield on the 10-year starts falling despite high deficits, that would be a strong signal that markets are re-prioritizing geopolitical safety over fiscal sustainability.
As of the time of this writing, the 10-year yield has risen to 4.397% from a reading of nearly 4.375% before the Iranian bombing, which does not yet signal any safety haven effects. We would need to see a drop of around 10 basis points to confirm that global investors are seeking refuge in U.S. debt, which would signal a serious concern about the ongoing military conflict.

Source: CNBC
Bitcoin Prices
Bitcoin has long been regarded as a “risk-on” asset, rising when investors are bullish and falling during periods of market fear.
Following the U.S. bombing in Iran, Bitcoin's price dropped from approximately $102,300 to $98,700 and has since recovered to $101,234. Despite this decline, the price action so far suggests that concerns about the ongoing military conflict are minimal.
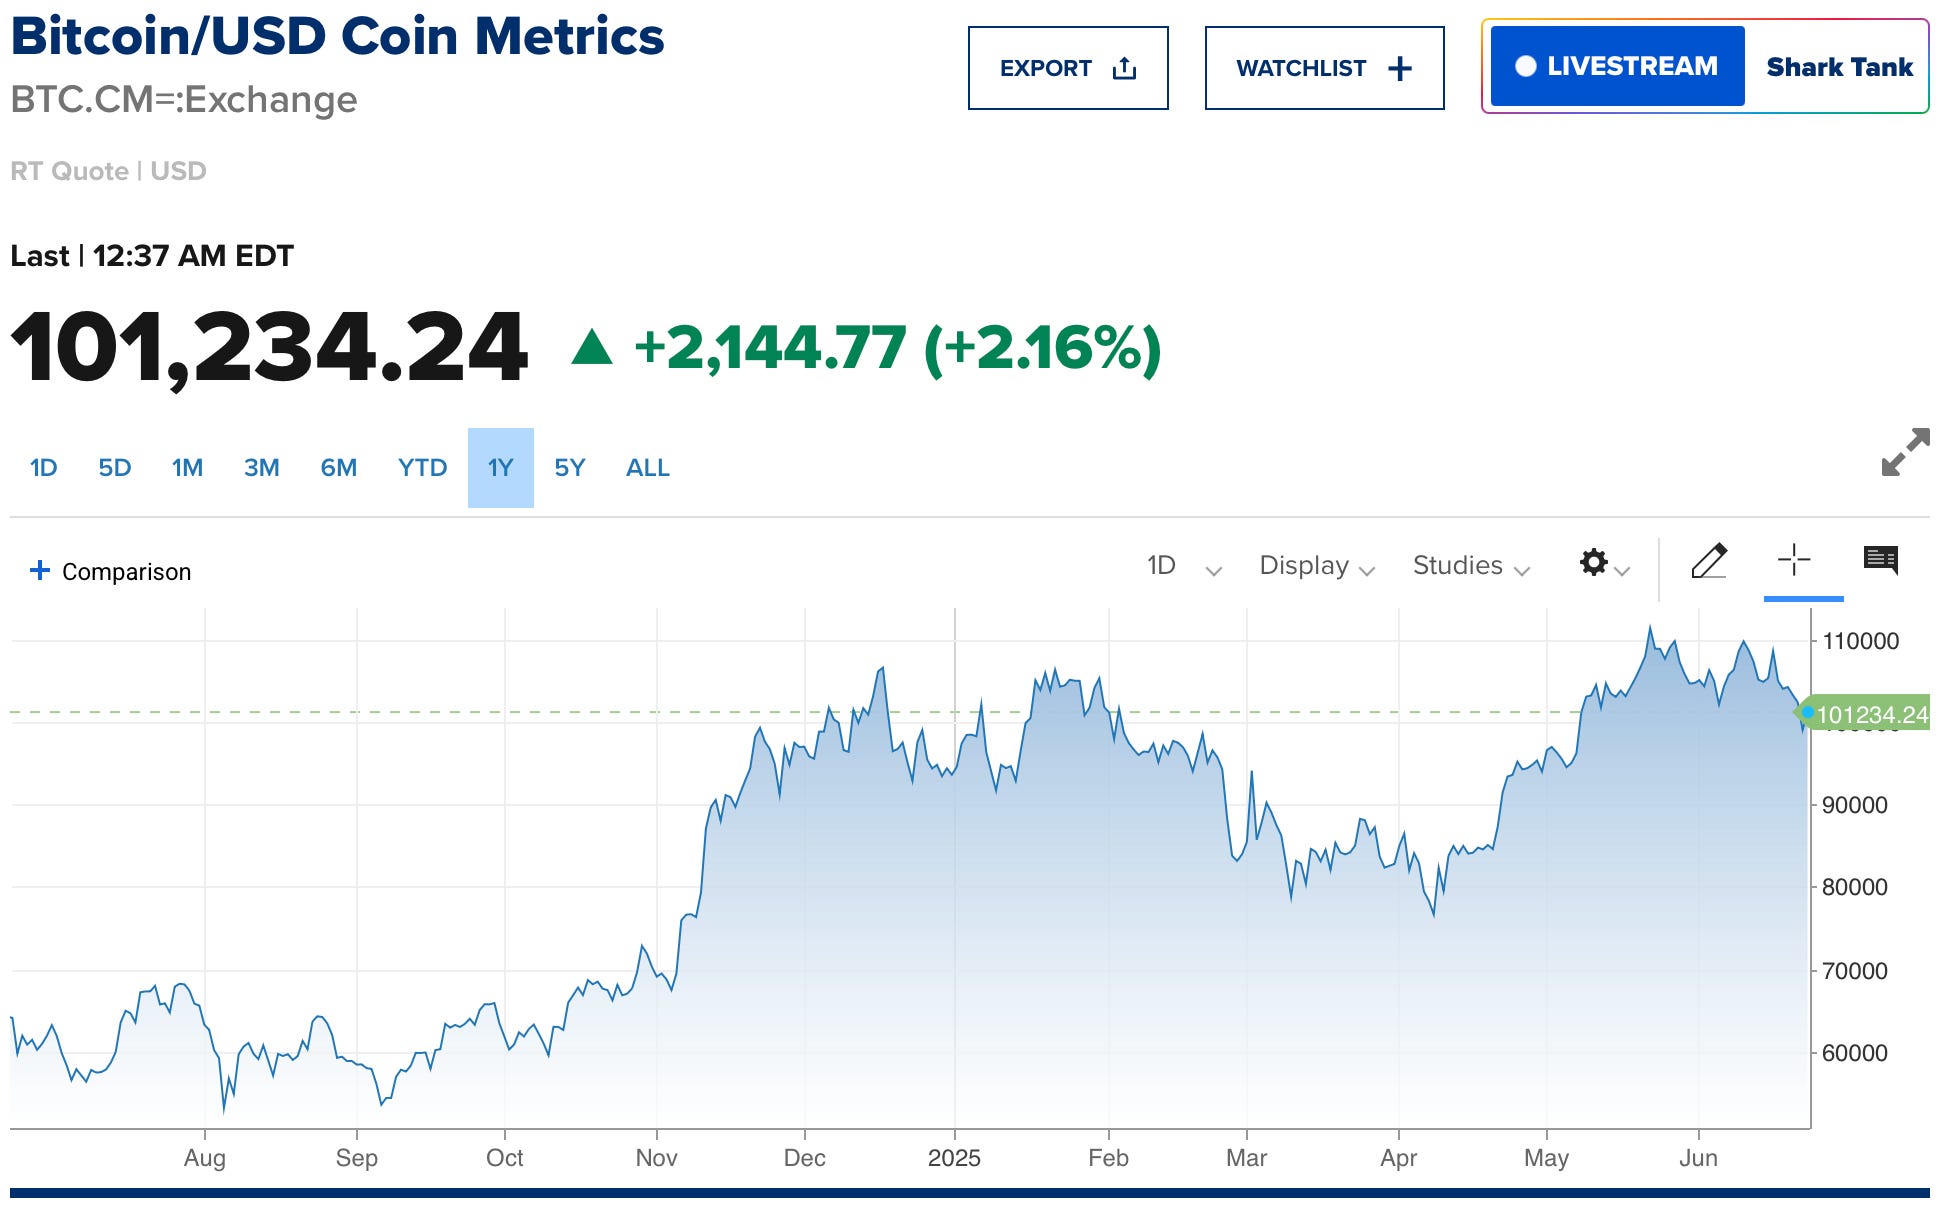
Source: CNBC
We would interpret a drop below $99,000 in the next few days as an indication that this metric may anticipate a potential escalation of military tensions.
Summary and Concluding Thoughts
The unique aspect of this moment is that our highlighted metrics are blinking yellow, and none are yet flashing red. That could change quickly if the U.S. carries out additional strikes, or if Iran retaliates in asymmetric ways (via proxies or cyberattacks), or if global oil shipping is disrupted.

Whether or not this military conflict escalates or morphs into a stalemate or is resolved quickly, the movements of the DXY, the 10-year Treasury, Bitcoin, and prediction markets are likely to tell us first.
In crises like this, headlines are often noisy, speculative, and emotionally charged. Financial markets, by contrast, tend to be cold, calculating, and brutally honest, as they discount risk in real time.
For this reason, we are providing our readers with a basket of 5 key metrics to watch, enabling them to gain a better understanding of how financial markets are interpreting the ongoing U.S.-Iran military conflict in real-time.